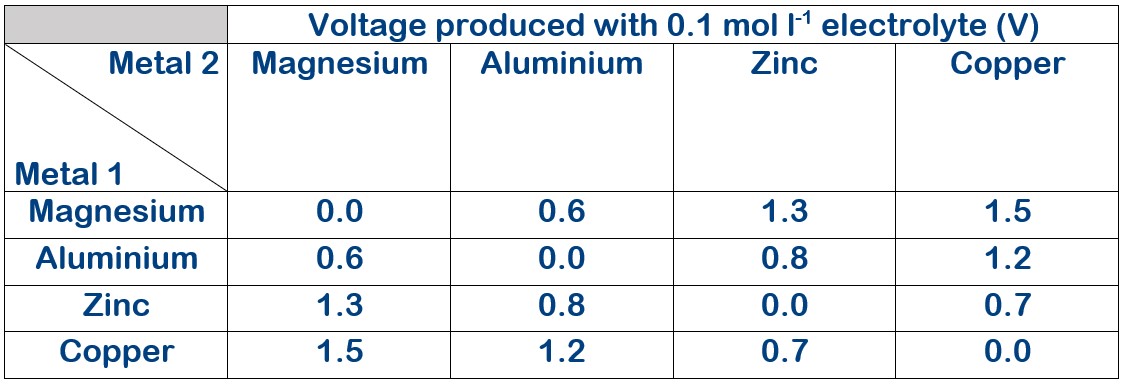
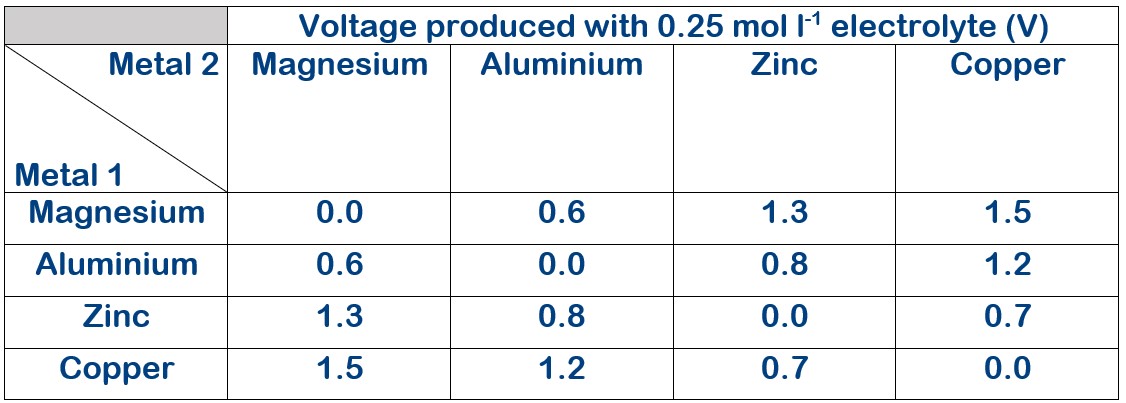
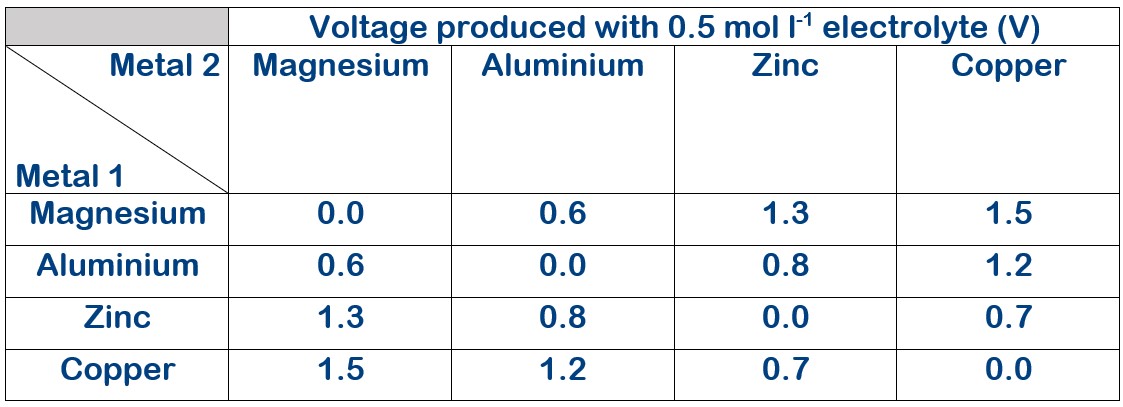
Except where stated otherwise, the electrolyte used was sodium chloride solution
Electrolyte concentration 0.1 mol l-1
Electrolyte concentration 0.25 mol l-1
Electrolyte concentration 0.5 mol l-1
Electrolyte concentration 1.0 mol l-1
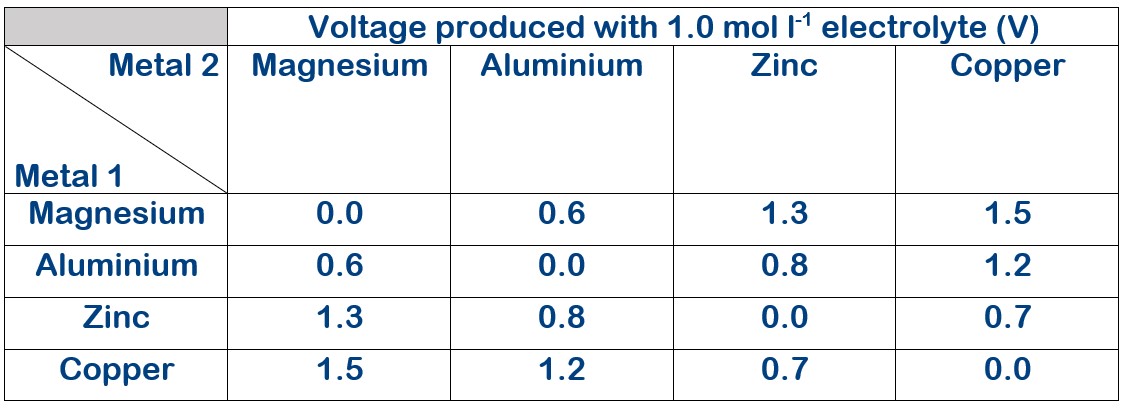
The voltage produced with varying electrolyte concentration.
and
All done using (Mg/Cu electrodes)
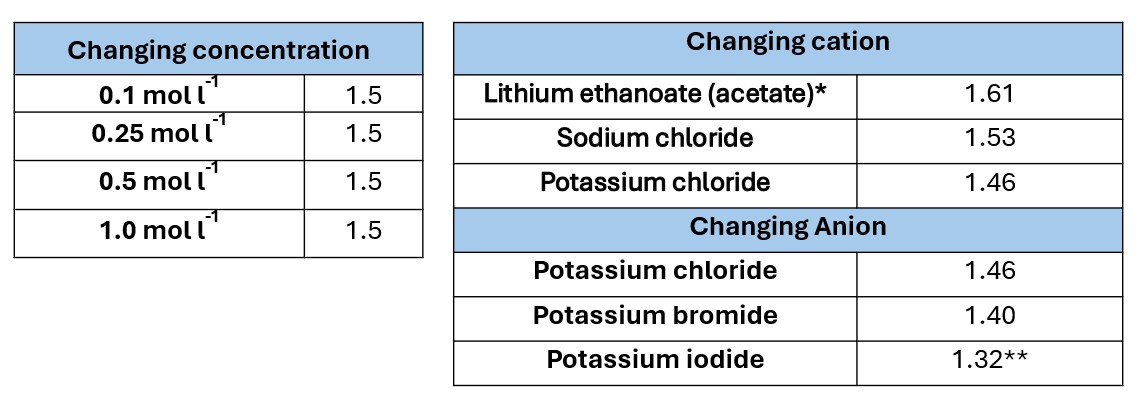
* No LiCl was available at the time. The reading is likely to be a little lower than would have been with the chloride. A comparison of Sodium chloride with sodium ethanoate showed voltages of 1.53 and 1.46 respectively
** The potassium iodide was slightly yellow so some of it had become iodine, lowering the concentration of iodide ions slightly.
Although the mechanism seems obscure, we suspect it has something to do with ion radius and mobility.
SSERC is a Company Limited by Guarantee and a registered educational charity.
Headquarters
1-3 Pitreavie Court,
South Pitreavie Business Park,
Dunfermline,
KY11 8UU
☎ 01383 626070
Registered Office
Morton Fraser MacRoberts LLP,
Level 5
9 Haymarket Square
Edinburgh
EH3 8RY
Material on this website, including text and images, is protected by copyright. It may not be copied, reproduced, republished, downloaded, posted, broadcast or transmitted in any way except for your own personal, non-commercial use, or for educational use. Prior written consent of the copyright holder must be obtained for any other use of material. Copyright in all materials and/or works comprising or contained within this website remains with SSERC and other copyright owner(s) as specified. No part of this site or sub-domains of this site may be distributed or copied for any commercial purpose
© Copyright 2024 Copyright SSERC Ltd. All Rights Reserved.